Understanding ANOVA with a Numerical Block Design in E-commerce
Introduction:
In the e-commerce world, businesses often conduct experiments to optimize various aspects like website design, customer experience, pricing strategies, or marketing campaigns. When running such experiments, we may encounter variability that isn’t due to the factor we’re interested in. To account for this, we use ANOVA block designs. This method helps control for extraneous variability, allowing businesses to focus on the factor of interest.
In this blog, we’ll explain a numerical ANOVA block design in the context of an e-commerce website testing different advertising methods while accounting for variation due to days of the week.
Table of Contents
What is an ANOVA Block Design?
In the context of e-commerce, an ANOVA block design allows businesses to account for external factors that can impact results. For example, customer behavior may vary based on the day of the week, so we create blocks to account for this variability. Our goal is to focus on the effects of the factor of interest (e.g., different advertising methods) while controlling for day-to-day variations.
Example Scenario
An e-commerce company wants to determine which of three advertising methods generates the highest number of sales. The company runs ads on three different platforms: Google Ads, Facebook Ads, and Instagram Ads. However, sales tend to fluctuate depending on the day of the week, so they divide the data into blocks based on days.
Each day, the company runs all three types of ads and records the number of sales generated.
Day
Google Ads
Facebook Ads
Instagram Ads
Monday
30
32
34
Tuesday
35
30
33
Wednesday
40
42
41
Thursday
38
37
29
*Number of sales in 1000’s (K)
Blocks (Days) represent the days of the week (Monday, Tuesday, etc.).
Treatments (Ad Platforms) represent the advertising methods: Google Ads, Facebook Ads, and Instagram Ads.
ANOVA Block Design Breakdown
In this scenario, we apply a Two-Way ANOVA with:
Factor 1 (Advertising Methods) – We are interested in testing if the different advertising platforms lead to significantly different sales.
Blocking factor (Days of the Week) – We account for variation in sales across different days.
In simple terms, the goal of the example above is to figure out which advertising platform—Google Ads, Facebook Ads, or Instagram Ads—brings in the most sales for an e-commerce business. However, sales can vary depending on the day of the week, like more sales happening on weekends than weekdays. This day-to-day variation might make it hard to see which ad platform is actually the best.
To deal with this, we use something called a block design. In this case, the days of the week act as “blocks,” helping us separate the effect of the day from the effect of the ad platforms. That way, we can focus more on comparing the ad platforms without the results getting mixed up by sales fluctuations caused by the days themselves.
By doing this, we’re aiming to figure out if the differences in sales are really due to the ad platforms or just due to the natural differences in sales that happen on different days of the week.
To sum it up:
We’re testing which ad platform is better (Google, Facebook, or Instagram).
We’re blocking out the effect of different days of the week, so that doesn’t confuse the results.
The math helps us see if there’s a real difference between the ad platforms or if the differences we see are just because sales vary by day.
Step-by-Step Numerical Breakdown
Step 1: Calculate the Grand Mean
The grand mean is the overall average number of sales across all days and platforms.
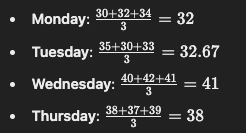
Step 2: Calculate the Block (Day) Means
Now, we calculate the average sales per day:
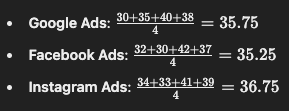
Step 3: Calculate the Treatment (Ad Platform) Means
Next, we calculate the average sales per advertising platform:
Step 4: Total Sum of Squares (SST)
The Total Sum of Squares (SST) measures the total variability in sales:
For example, for Monday’s Google Ads sales:
We calculate this for all values:
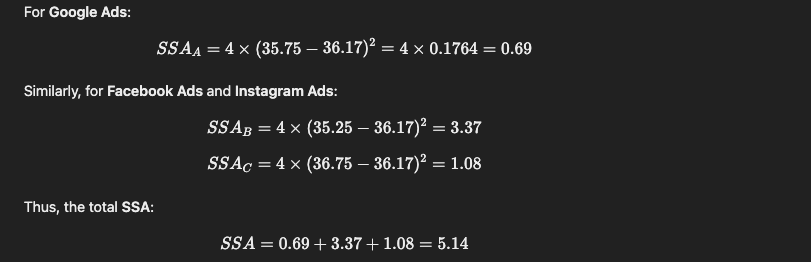
Step 5: Treatment Sum of Squares (SSA)
The Treatment Sum of Squares (SSA) measures the variability due to the ad platforms:
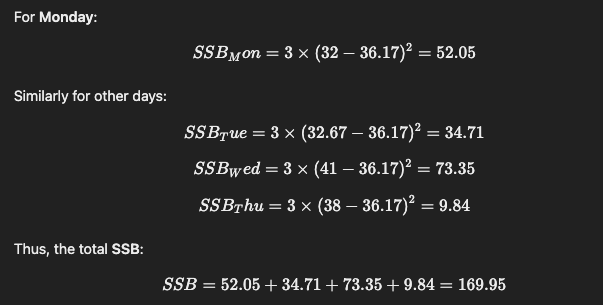
Step 6: Block Sum of Squares (SSB)
The Block Sum of Squares (SSB) measures the variability due to days of the week:
Step 7: Error Sum of Squares (SSE)
The Error Sum of Squares (SSE) is the leftover variability after accounting for treatments (ad platforms) and blocks (days of the week):
Step 8: Perform the ANOVA Test
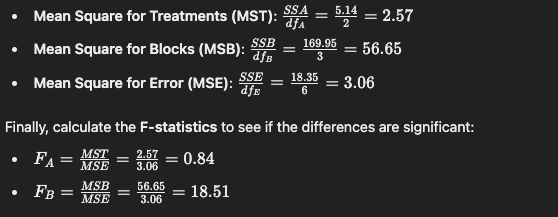
Now, we calculate the Mean Squares for treatments and blocks:
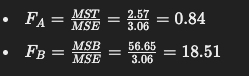
Finally, calculate the F-statistics to see if the differences are significant:
We would compare these F-values with critical values from an F-distribution table to determine if the differences are significant.
Conclusion
The F-statistic for the ad platforms (0.84) is relatively small, meaning the difference in sales between Google, Facebook, and Instagram may not be significant.
The F-statistic for the blocks (days of the week) is much larger (18.51), indicating that sales vary significantly depending on the day.
In this example, blocking by days helped control for the natural day-to-day variability in sales, allowing us to focus on whether different ad platforms significantly affect sales. While the ads might not show a huge difference, knowing that sales vary by day can help the e-commerce business make more informed decisions about when and where to allocate their ad budget.
We analyzed how different ad platforms (Google, Facebook, Instagram) impact sales while controlling for day-to-day sales fluctuations using an ANOVA block design. This helped us isolate the effect of the ad platforms and determine if sales differences were significant across the platforms or primarily due to the day of the week.