Understanding the Test of Independence and Its useful Application in E-commerce Data
In the realm of e-commerce, understanding customer behavior is crucial for making data-driven decisions. The Chi-Square Test of Independence is a powerful statistical tool that helps analyze the relationship between two categorical variables. This blog will explore what the test of independence is and how to use it in an e-commerce context, with a practical numerical example to guide you.
Table of Contents
What is the Test of Independence?
When to Use the Test of Independence?
Steps to Perform the Test of Independence
Example: Applying the Test of Independence on E-commerce Data
Scenario:
Data
Hypotheses
Step 1: Calculate Expected Frequencies
Step 2: Calculate the Chi-Square Statistic
Step 3: Determine Degrees of Freedom and Critical Value
Step 4: Conclusion
Summary:
Scenario for Cart Abandonment Analysis:
Example:
Applying the Chi-Square Test:
Step-by-Step for Cart Abandonment:
Interpretation:
Other Applications of Chi-Square for Cart Abandonment:
Conclusion
What is the Test of Independence?
The Chi-Square Test of Independence helps us determine whether two categorical variables are associated or independent. This test is widely used in various industries, including e-commerce, to understand patterns in data such as purchase behavior, device usage, customer demographics, and more.
The null hypothesis (H₀) for this test states that the two variables are independent, whereas the alternative hypothesis (H₁) suggests an association between them.
When to Use the Test of Independence?
In an e-commerce context, this test can answer questions like:
Is there a relationship between device type (mobile or desktop) and purchasing behavior (purchase or no purchase)?
Does the time of day influence the type of products customers buy?
Businesses can optimize marketing efforts, improve product recommendations, and enhance customer experience by analyzing these relationships.
Steps to Perform the Test of Independence
Let’s break it down:
Define the Hypotheses:
Null Hypothesis (H₀): The two variables are independent.
Alternative Hypothesis (H₁): The two variables are associated.
Create a Contingency Table: This table shows the frequency distribution of the variables. For instance, it might display how many purchases occurred on mobile versus desktop.
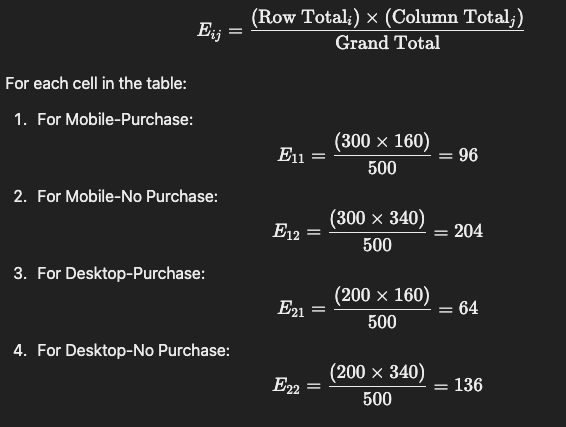
Calculate the Expected Frequencies: If the two variables are independent, the expected frequency for each cell in the table is calculated using the formula:
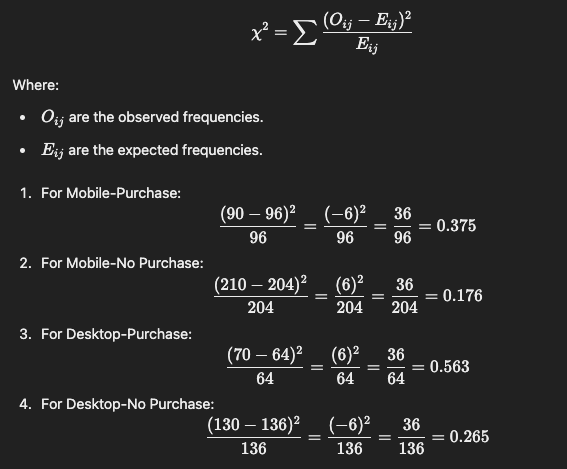
Compute the Chi-Square Statistic: The Chi-Square statistic is calculated as:
where O is the observed frequency and EEE is the expected frequency.
Compare with the Critical Value: Based on the degrees of freedom and a chosen significance level (usually 0.05), compare the computed Chi-Square statistic to a critical value. If the statistic exceeds the critical value, reject the null hypothesis.
Example: Applying the Test of Independence on E-commerce Data
Scenario:
Suppose you run an e-commerce website, and you want to determine if device type (mobile vs. desktop) and purchase decision (purchase vs. no purchase) are independent.
Data
You collect data for 500 visitors, summarized in the contingency table below:
Purchase
No Purchase
Total
Mobile
90
210
300
Desktop
70
130
200
Total
160
340
500
Here, the rows represent the device type (mobile or desktop), and the columns represent whether the customer made a purchase or not.
Hypotheses
Null Hypothesis (H₀): Device type and purchase decision are independent.
Alternative Hypothesis (H₁): Device type and purchase decision are not independent.
Step 1: Calculate Expected Frequencies
To calculate the expected frequencies under the assumption of independence, we use the formula:
The table of expected frequencies is:
Purchase (Expected)
No Purchase (Expected)
Mobile
96
204
Desktop
64
136
Step 2: Calculate the Chi-Square Statistic
We use the formula for the Chi-Square statistic:
Now, summing these values: χ2=0.375+0.176+0.563+0.265=1.379
Step 3: Determine Degrees of Freedom and Critical Value
Step 4: Conclusion
Summary:
In this example, the test suggests that the choice of device (mobile or desktop) does not significantly impact the likelihood of a purchase on the e-commerce site.
Scenario for Cart Abandonment Analysis:
Let’s say you want to investigate whether device type (mobile vs. desktop) affects cart abandonment (whether the customer abandoned the cart or completed the purchase). You can use the same approach, where the two categorical variables are:
Device Type: Mobile vs. Desktop.
Cart Abandonment: Abandoned Cart vs. Completed Purchase.
Example:
Suppose you collect the following data:
Abandoned Cart
Completed Purchase
Total
Mobile
120
180
300
Desktop
80
120
200
Total
200
300
500
Here, we have:
Mobile users abandoned 120 carts and completed 180 purchases.
Desktop users abandoned 80 carts and completed 120 purchases.
Applying the Chi-Square Test:
Just like the previous example, we want to determine if cart abandonment is independent of device type.
Observed Values are given in the table above.
Expected Values would be calculated based on the row and column totals under the assumption of independence.
Calculate the Chi-Square statistic to determine if the observed differences are significant.
Step-by-Step for Cart Abandonment:
Null Hypothesis (H₀): Cart abandonment is independent of device type.
Alternative Hypothesis (H₁): Cart abandonment is dependent on device type.
You calculate expected frequencies using the same formula mentioned previously in the post.
Then, use the Chi-Square formula to check if the difference between the observed and expected frequencies is statistically significant.
Interpretation:
If your Chi-Square statistic is higher than the critical value (based on degrees of freedom and significance level), you would reject the null hypothesis and conclude that device type significantly affects cart abandonment. If not, you would fail to reject the null hypothesis, meaning there’s no significant association between device type and cart abandonment.
Other Applications of Chi-Square for Cart Abandonment:
Apart from device type, the Chi-Square Test can be applied to check the impact of other factors on cart abandonment, such as:
Payment Method: Is cart abandonment independent of the preferred payment method (credit card, PayPal, etc.)?
User Demographics: Does cart abandonment vary by age group, gender, or location?
Time of Day: Does the time of visit (morning vs. evening) affect cart abandonment rates?
In each case, the test will help you understand if these factors are influencing cart abandonment on your e-commerce platform.
Conclusion
The Chi-Square Test of Independence is a simple yet powerful tool to uncover relationships between categorical variables in e-commerce data. By applying it, businesses can gain valuable insights into customer behavior and improve their strategies. Whether you’re analyzing purchasing patterns, customer demographics, or device usage, this test can help you make data-driven decisions to enhance your business performance.
With this understanding, you can start applying the test of independence to your e-commerce data and discover valuable insights about your customers!
In a nutshell, test checks whether two categorical variables are independent of each other.